- Market Overview
- Futures
- Options
- Charts
- Custom Charts
- Spread Charts
- Market Heat Maps
- Historical Data
- Stocks
- Real-Time Markets
- Site Register
- Mobile Website
- Trading Calendar
- Futures 101
- Commodity Symbols
- Real-Time Quotes
- CME Hedging Resource Center
- Farmer's Almanac
- USDA Reports
Oversold and Under Pressure: Are You Ready to Tackle Natural Gas Volatility?

Natural gas prices, October futures, are scraping along at $3.039 per million British thermal units (MMBtu) as of September 15, 2025, teetering just above the critical $3.00 mark and near the bottom of their 52-week range of $2.738-$5.228. This dip, a steep 16% drop since the start of the year, tells a story of abundant supply outpacing demand. High U.S. production, bulging storage levels, and milder September weather have curbed consumption, particularly in the power sector.
What’s driving this market slump, and how did we get here?
A mix of robust domestic output, storage inventories well above the five-year average, and strategic production restraint from U.S. drillers has created a supply-heavy environment. In addition to that, increased Canadian gas is flooding the Northwest, and renewable energy is displacing natural gas in key regions; it’s clear why prices are struggling. In the upcoming analysis, we’ll dive deeper into the technical and seasonal trends shaping the natural gas market. We will explore what these low prices signal for the months ahead and how supply, demand, and weather will continue to steer the course.
Technical
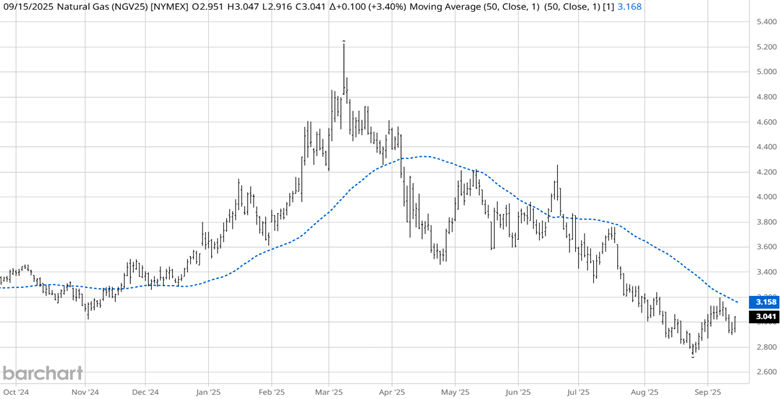
Source: Barchart
Since the last heating season price peak of $5.228 in March 2025, October futures Natural gas prices have declined to $2.738. Price found some support under the psychological number of $3.000 and rallied. With bearish fundamentals weighing heavily on prices, the question is, where do Natural Gas prices go from here?
Technically, the October futures are bearish as the 50 simple moving average (SMA) continues to contain any rallies and prices are rejected lower. All trends can become overextended and need to be corrected at some point. In the case of Natural Gas, the shorts can take some profits and the bottom fishers can scalp a few ticks.
An area of interest for the downtrend will be if prices can trade above the prior high of $3.198. If prices can manage this, then price action traders may believe the trend is changing with higher lows and higher highs. The bulls will look for an extension of this move higher, and the bears will plan on a 1-2-3 correction pattern. If the correction pattern unfolds, it will play nicely with the upcoming seasonal sell pattern, which I’ll discuss soon.
Seasonal Pattern
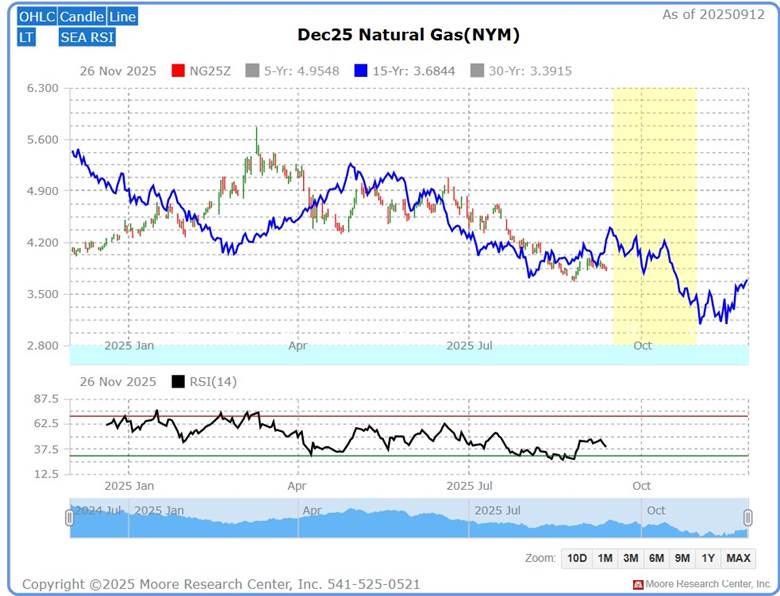
Source: Moore Research Center, Inc. (MRCI)
MRCI research has found a seasonal sell window (yellow box) in the December natural gas contract for 45 calendar days. During this 15-year historical pattern (blue line), natural gas has closed lower on approximately October 30 than on September 16 for 12 of the past 15 years, an 80% occurrence rate. During this period, in hypothetical testing, the average profit was .430 or $2,785 per standard-size contract. In addition, there were 4 years of no daily closing drawdowns.
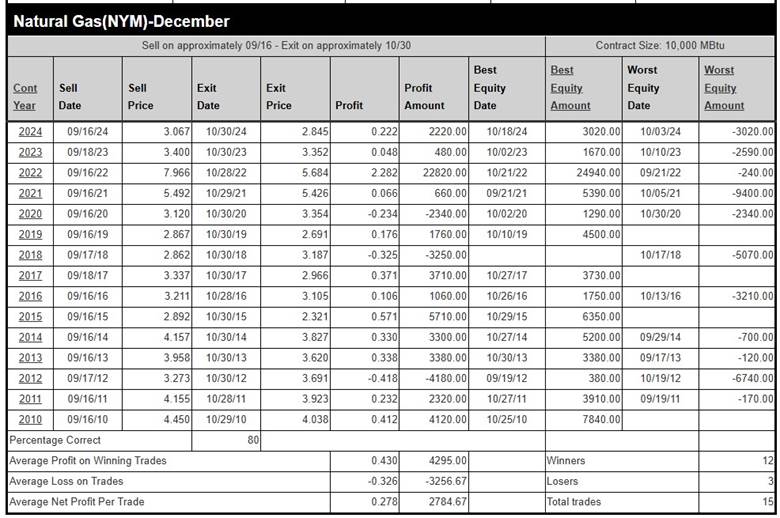
Source: MRCI
On the daily chart, I’ve left the Relative Strength Index (RSI) 14-period on. The last time the RSI traded down to the oversold level of 30, the market had a countertrend rally. Recently, the market has traded at the 30 level again before rising. The YTD 16% decline may have led to a temporary oversold level for the natural gas market. The current price rally may offer a better selling opportunity at a higher price level.
As a crucial reminder, while seasonal patterns can provide valuable insights, they should not be the basis for trading decisions. Traders must consider various technical and fundamental indicators, risk management strategies, and market conditions to make informed and balanced trading decisions.
Assets to Trade the Natural Gas Market
For futures traders:
NG is the standard-size contract.
QG is the mini-size contract.
CN is the micro-sized contract.
For equity traders:
An exchange-traded fund (ETF) symbol UNG. Be aware that UNG does not track futures returns consistently.
Options traders:
Puts & Calls are available for all of the natural gas contracts.
In Closing…
As we’ve explored, the natural gas market is under significant pressure, with October futures languishing at $3.039 per MMBtu, down 16% year-to-date and hovering near the lower end of the 52-week range of $2.738-$5.228. Readers have learned that robust U.S. production, elevated storage levels, and milder September weather have suppressed demand. Meanwhile, increased Canadian supply and renewable energy adoption in the Northwest further weigh prices. Technically, the market remains bearish, with the 50-day SMA capping rallies, though an oversold RSI at 30 hints at potential short-term rebounds. Seasonally, the December contract’s historical 80% tendency to decline from mid-September to late October, as highlighted by MRCI’s 15-year historical data, suggests a continued downward bias, with an average profit of $2,785 per standard contract in hypothetical testing. These insights into supply, demand, technical trends, and seasonal patterns clearly show the forces driving the current price slump.
However, natural gas is a volatile market, and while these technical and seasonal signals offer valuable context, they come with risks. Traders must approach this market with robust risk management, combining technical indicators like the 50-day SMA and RSI with fundamental analysis and disciplined position sizing. Whether trading standard (NG), mini (QG), or micro (CN) futures contracts, or exploring ETFs like UNG or options, the market’s swings demand caution. A potential break above $3.198 could signal a shift in trend, but a seasonal sell-off or correction pattern may align with bearish fundamentals. Stay vigilant, use stop-loss orders, and never rely solely on seasonal patterns—blend all tools to navigate this unpredictable market wisely.
On the date of publication, Don Dawson did not have (either directly or indirectly) positions in any of the securities mentioned in this article. All information and data in this article is solely for informational purposes. For more information please view the Barchart Disclosure Policy here.