- Market Overview
- Futures
- Options
- Charts
- Custom Charts
- Spread Charts
- Market Heat Maps
- Historical Data
- Stocks
- Real-Time Markets
- Site Register
- Mobile Website
- Trading Calendar
- Futures 101
- Commodity Symbols
- Real-Time Quotes
- CME Hedging Resource Center
- Farmer's Almanac
- USDA Reports
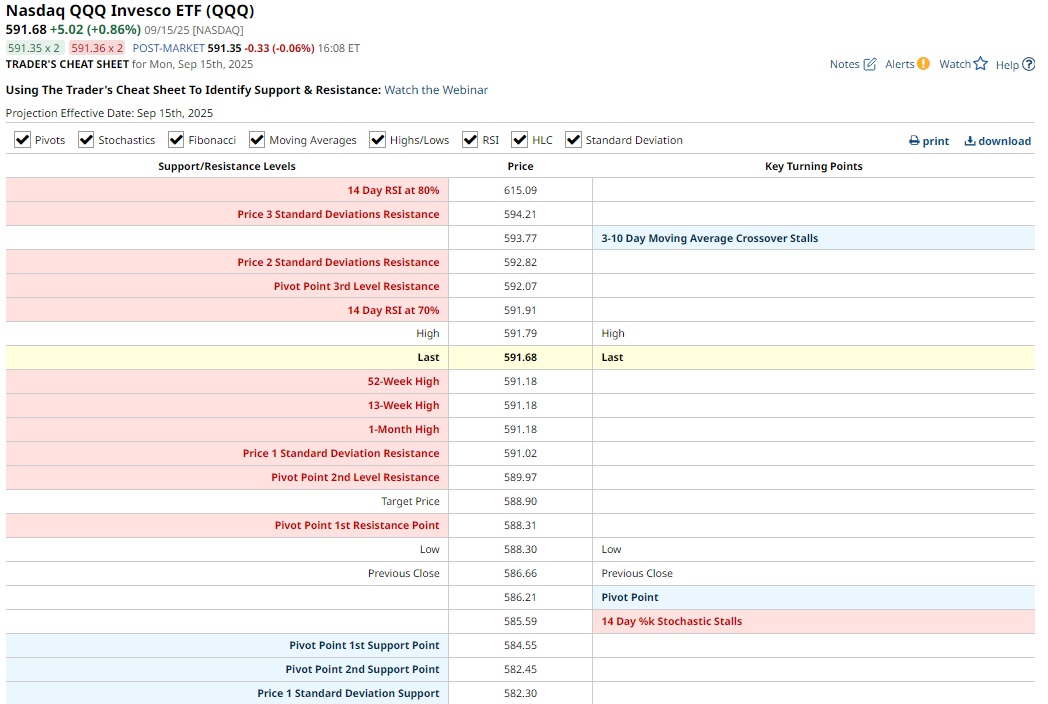
Technical Trader's Cheat Sheet: Color-Coded Chart Support & Resistance at a Glance

Trading can be overwhelming — multiple indicators, different timeframes, and endless signals. That’s why Barchart created the Trader’s Cheat Sheet, a single page that brings together 50 of the most commonly used technical indicators and turns them into actionable levels for the next trading day.
During a recent live webinar, John Rowland, CMT, walked through how to use the Cheat Sheet to spot support, resistance, and potential breakouts.
How the Cheat Sheet Works
The Cheat Sheet organizes key chart levels from highest price to lowest price, giving traders a “ladder” of significant price points to watch.
- Updated daily → Values are refreshed at the end of each market session.
- Color-coded signals → Blue = bullish interpretation; Red = bearish.
- Support and resistance → Blue levels below current price = support, red levels above = resistance.
- Trigger levels → If price crosses a listed level (like a moving average or Fibonacci retracement), it can signal a breakout, breakdown, or trend reversal.
What’s Included
The Cheat Sheet pulls from a wide range of technical tools:
- Pivots (support, resistance)
- Stochastics
- Fibonacci retracements
- Moving averages (crossovers, stalls)
- Highs/Lows (1-month, 13-week, 52-week)
- RSI (14-day Relative Strength Index)
- HLC (high, low, close for previous session)
- Standard Deviation bands
This makes it a one-stop shop for both short-term traders and longer-term investors who want to see where support/resistance is building.
Why It’s Useful
- Market Timing → Blue below and red above the last price = consolidation. Blue above or red below = potential breakout.
- Confirmation → Levels close to current price are most relevant for confirming short-term moves.
- Efficiency → Instead of scanning dozens of indicators, traders get a curated list of 50 signals in one place.
As John noted, the Cheat Sheet doesn’t predict direction on its own — but it shows you where the market may react, giving traders an edge in planning entries and exits.
How to Use the Trader’s Cheat Sheet
- Access the Trader’s Cheat Sheet for any stock, ETF, or futures contract.
- Combine it with Interactive Charts to see how price reacts to listed levels.
- Pair with the Barchart Opinion tool to confirm bullish or bearish signals.
Bottom Line
The Trader’s Cheat Sheet gives you an actionable daily roadmap of support, resistance, and trigger levels across 50 indicators. For traders, it’s a way to simplify decision-making and focus only on the signals that matter.
Watch this quick clip from John Rowland’s webinar where he breaks down how to use this tool, and check out the full lesson from our archives.
On the date of publication, Barchart Insights did not have (either directly or indirectly) positions in any of the securities mentioned in this article. All information and data in this article is solely for informational purposes. For more information please view the Barchart Disclosure Policy here.